
Adverse Event Rate & Relative Risk Calculator
Group A (Treatment)
Sum of years all subjects were on treatment
Group B (Control/Comparator)
Sum of years all subjects were on treatment
1. Simple Incidence Rate (IR)
Calculated as: (Subjects with Event / Total Subjects) × 100.
Note: This method ignores time/exposure duration.
Group A
0%
Group B
0%
Group A
Group B
2. Exposure-Adjusted Incidence Rate (EAIR)
Calculated as: (Events / Patient-Years) × 100.
This normalizes for different treatment durations.
Group A
0 per 100 PY
Group B
0 per 100 PY
3. Incidence Rate Ratio (IRR)
Compares the risk between groups based on EAIR.
Formula: EAIR Group A / EAIR Group B.
Relative Risk (IRR):
0.00
0.00
Why this matters: Notice how the Simple IR suggests a difference of only 0% points, but when accounting for exposure time (EAIR), the actual rate in Group A is 0x higher than Group B. Ignoring exposure time can significantly underestimate risk in long-term studies.
Imagine you are reviewing the safety data for a new medication. The report says that 15% of patients in Group A experienced headaches, while only 10% of patients in Group B did. On the surface, it looks like Group A has a worse side effect profile. But what if everyone in Group A took the drug for two years, while people in Group B dropped out after just three months? That simple percentage is hiding a crucial detail: time. This is where understanding adverse event rates moves beyond basic math into real-world safety assessment.
In clinical trials, how we calculate risk changes everything. If you get the calculation wrong, you might approve a dangerous drug or reject a life-saving one. The regulatory landscape, led by agencies like the FDA, is shifting away from simple percentages toward more nuanced methods that account for how long a patient is actually exposed to a treatment. Let’s break down the numbers so you can see exactly what they mean for patient safety.
The Problem with Simple Percentages (Incidence Rate)
The most common way to report adverse events is the Incidence Rate (IR). It is straightforward: take the number of subjects who had an event and divide it by the total number of subjects treated. You get a clean percentage, like "20% of patients reported nausea." It is easy to read and easy to explain to non-experts.
However, this method ignores time completely. In a short-term study where everyone takes the drug for the same duration, IR works fine. But in chronic disease studies-like those for diabetes or hypertension-patients stay on the drug for years. Some stop early due to side effects; others continue for decades. When follow-up times vary wildly between groups, the simple IR becomes misleading. Research cited in PharmaSUG 2024 papers shows that IR can underestimate true event rates by 18-37% in trials with uneven exposure durations. You are comparing apples to oranges when one group was watched closely for a year and the other for a week.
Introducing Time: Exposure-Adjusted Incidence Rate (EAIR)
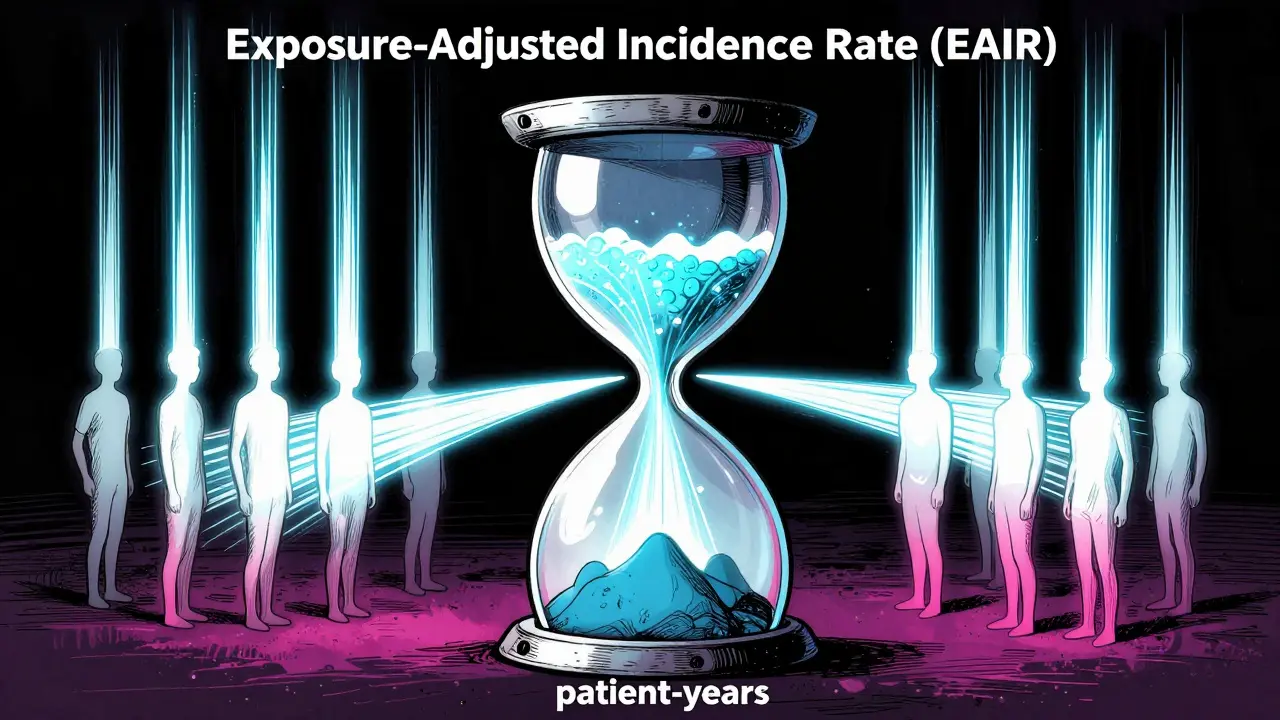
To fix the time gap, statisticians use the Exposure-Adjusted Incidence Rate (EAIR). Instead of counting people, EAIR counts patient-years. Think of it as measuring the total amount of time all patients spent taking the drug combined. If ten patients take a drug for one year each, you have 10 patient-years. If five patients take it for two years each, you also have 10 patient-years.
The formula divides the number of adverse events by these patient-years. The result is usually expressed as events per 100 patient-years. This method levels the playing field. It allows you to compare a drug taken briefly by many people against a drug taken long-term by fewer people. The FDA has signaled a strong preference for this approach. In a 2023 Supplemental Biologics License Application (sBLA), the agency explicitly requested EAIR analysis because traditional percentages failed to capture the true risk profile over varying treatment lengths.
| Method | Denominator | Best Used For | Key Limitation |
|---|---|---|---|
| Incidence Rate (IR) | Total subjects | Short trials with equal follow-up | Ignores exposure time; misleading in long-term studies |
| Exposure-Adjusted Incidence Rate (EAIR) | Patient-years | Chronic therapies; variable drop-out rates | Complex to calculate; requires precise date tracking |
| Event Incidence Rate (EIR) | Patient-years (per event type) | Recurrent events (e.g., multiple falls) | Can overstate risk if one patient has many minor events |
Calculating Relative Risk and Confidence Intervals
Once you have your rates, you need to compare them. This is where Relative Risk comes in. Specifically, we often look at the Incidence Rate Ratio (IRR). If Group A has an EAIR of 5 events per 100 patient-years and Group B has 2.5, the IRR is 2.0. This means patients in Group A are twice as likely to experience the event per unit of time compared to Group B.
But a single number isn’t enough. We need to know if this difference is real or just random noise. Statisticians calculate confidence intervals around these ratios. According to research by Kirsi Marjaana Manz from Ludwig-Maximilians-Universität München, the Wald method is commonly used for IRR confidence intervals. These intervals tell us the range within which the true risk ratio likely falls. If the interval includes 1.0, the difference between the groups might not be statistically significant. Understanding these margins of error is critical for making go/no-go decisions in drug development.
The Complication of Competing Risks
Safety analysis gets trickier when death is a possibility. In oncology trials, for example, a patient might die before they can experience a specific adverse event like liver toxicity. This is called a "competing risk." Traditional statistical tools like the Kaplan-Meier estimator often fail here because they assume that if a patient drops out, they could still have the event later. But if they died, they definitely won't develop liver toxicity.
A 2025 article in Frontiers in Applied Mathematics and Statistics by Tang and Wahed highlights this issue. They argue against using standard survival analysis methods for adverse events when competing risks are high. Instead, they propose cumulative hazard ratio estimation. This method decomposes the risk into cause-specific hazards. Their simulations showed this approach is 22% more accurate than traditional methods when competing event rates exceed 15%. Ignoring competing risks can lead to inflated estimates of safety, giving regulators a false sense of security.
Regulatory Shifts and Industry Standards
The industry is moving fast to adapt to these statistical realities. The International Council for Harmonisation (ICH) E9(R1) addendum, implemented in late 2020, requires sponsors to consider treatment discontinuation and exposure time in their safety analyses. While it doesn't mandate one specific formula, it pushes companies toward exposure-adjusted metrics.
The European Medicines Agency (EMA) accepts both IR and EAIR but demands a clear justification for the choice. Meanwhile, the FDA is becoming stricter. Dr. Gary Koch, a biostatistics professor at UNC, testified before the FDA Advisory Committee in 2022 that failing to account for exposure time is a "fundamental statistical error." This sentiment is reflected in the rising adoption of EAIR. Data from the FDA submission database shows that submissions containing exposure-adjusted metrics jumped from 12% in 2020 to 47% in 2023.

Implementation Challenges in Real-World Trials
Knowing the theory is one thing; coding it correctly is another. Implementing EAIR requires precise data handling. You need exact start and end dates for every dose. A survey of clinical programmers at the 2024 PhUSE conference found that SAS implementation of EAIR takes 3.2 times longer than traditional IR calculations. Common errors include mishandling event dates (28% of cases) and failing to account for treatment interruptions (19% of cases).
Standardization helps. CDISC’s Therapeutic Area User Guide for Oncology now mandates both IR and EAIR reporting for serious adverse events. Organizations like PhUSE provide open-source SAS macros to reduce programming errors. Despite these tools, human interpretation remains a hurdle. Roche’s internal reports noted that 35% of medical reviewers initially misinterpreted EAIR results because they were accustomed to reading simple percentages. Training and clear visualization are essential to bridge this gap.
Why This Matters for Patient Safety
At the end of the day, these statistical nuances protect patients. MSD’s safety team reported that switching to EAIR revealed previously undetected safety signals in 12% of their reviewed programs. These were often chronic therapies where long-term exposure unmasked rare but serious side effects that simple percentages would have buried. By accounting for time and competing risks, we get a truer picture of a drug's safety profile. This ensures that the benefits of a treatment genuinely outweigh its risks, no matter how long a patient stays on it.
What is the difference between Incidence Rate (IR) and Exposure-Adjusted Incidence Rate (EAIR)?
Incidence Rate (IR) calculates the percentage of subjects experiencing an event, ignoring how long they were on the drug. Exposure-Adjusted Incidence Rate (EAIR) calculates events per patient-year, accounting for the actual duration of exposure. EAIR is more accurate for long-term studies where patients have different follow-up times.
Why does the FDA prefer exposure-adjusted methods?
The FDA prefers exposure-adjusted methods because they provide a more accurate assessment of risk when treatment durations vary. Simple percentages can underestimate or overestimate risk if one group stays on the drug longer than another. EAIR normalizes this by using patient-years as the denominator.
How do competing risks affect adverse event analysis?
Competing risks occur when an event like death prevents the observation of another adverse event. Standard methods like Kaplan-Meier may overestimate the risk of the secondary event. Newer methods, such as cumulative hazard ratio estimation, handle these scenarios more accurately by separating cause-specific hazards.
What is the Incidence Rate Ratio (IRR)?
The Incidence Rate Ratio (IRR) compares the rate of adverse events between two groups. It is calculated by dividing the incidence rate of one group by the rate of the other. An IRR greater than 1 indicates a higher risk in the first group, while less than 1 indicates lower risk.
Are there standards for calculating EAIR in clinical trials?
Yes, organizations like CDISC and ICH provide guidelines. CDISC’s Oncology User Guide mandates EAIR for serious adverse events. The FDA’s draft guidance proposes standardized calculation methods. Additionally, professional groups like PhUSE offer validated programming macros to ensure consistency across the industry.